
首页 » 实时空间气象数据---HF传播与日地数据
实时空间气象数据---HF传播与日地数据
晨昏线世界地图
数据来源:https://www.timeanddate.com/
这张地图显示了地球上的白天和黑夜,以及太阳(太阳下点)和月亮(月下点)现在的位置。
太阳辐射与地球电离层实时数据、HF传播数据
数据来源:http://www.hamqsl.com/
太阳活动多角度的影响了地球上无线电波的传输,当太阳风过于强烈进而导致地磁扰动的同时也会破坏有益电离层的分布密度,从而导致短波通信受阻。
SFI,太阳辐射,62-300 影响F层传播力;SN,太阳黑子,0-250 与SFI相关;
K,K指数,0-9 大于4为磁暴 地磁扰动分量;A,A指数,0-400 地磁活动日平均值 ;
X-ray,X射线,ABCMX级 影响D层 ;304A,304A,0-∞ 增强F层传播力;
Ptn Flx,质子密度,0-∞ 影响E层 ; Elc Flx,电子密度,0-∞ 影响E层;
Aurora,极光,影响10米到70厘米传播 ;Aur Lat,极光纬度,纬度越小范围越大;
BZ,星际磁场,-50-50 太阳粒子影响电离层;SW,太阳风,0-1000 大于500对高频不利;
最高可用频率与最低可用频率


数据来源:https://prop.kc2g.com 由KC2G编译,数据来源GIRO和NOAA;基于全球电台测量值的最大可用频率与最低可用频率世界地图。
The MUF map shows the Maximum Usable Frequency using colors and contour lines. MUF is the highest frequency that is expected to bounce off of the ionosphere on a path 3000km long. So the MUF along a path between two points shows the possibility of long-hop DX between those points on a given band. If the MUF is 12MHz, then 30 meters and longer will work, but 20 meters and shorter won’t. For long multi-hop paths, the worst MUF anywhere on the path is what matters. For single-hop paths shorter than 3000km, the usable frequency will be less than the MUF, because higher-angle signals “punch through” the ionosphere more easily. As you get closer to vertical, the usable frequency drops to the Critical Frequency (foF2).
The foF2 page shows a map similar to the MUF map, except that it displays the Critical Frequency (foF2). This one is simpler: it’s the highest frequency that you can use for NVIS (skywave communication “in your own backyard”). When foF2 gets up to 7MHz and above then 40 meters “goes short” and can be used for local contacts; if it goes down below 3MHz then 80 meters “goes long” and local stations disappear but far-away ones can still be reachable.
UV段传播数据
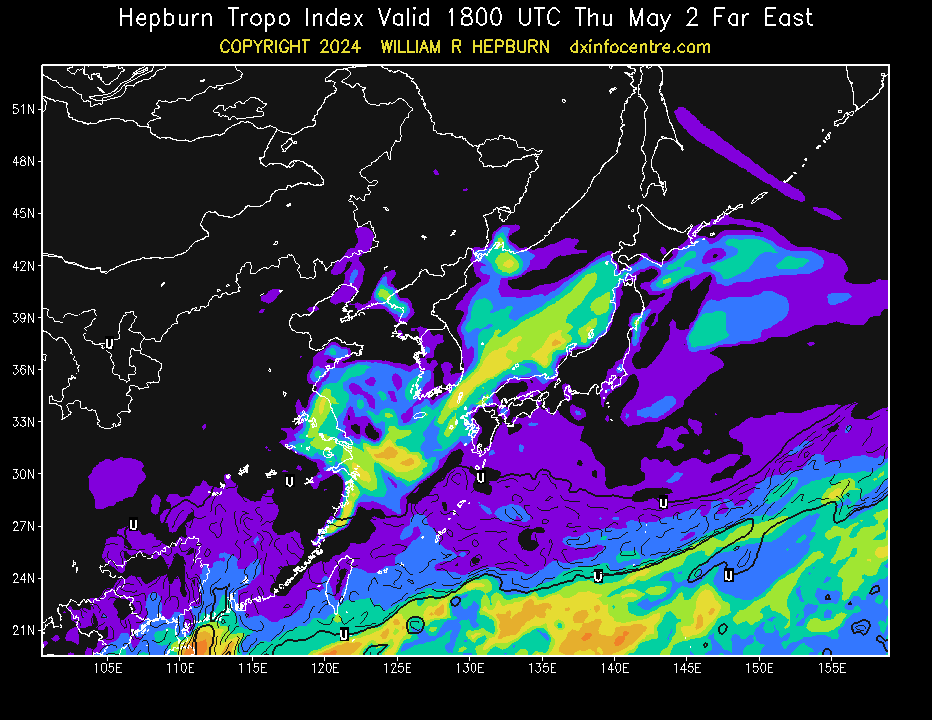

数据来源:https://www.dxinfocentre.com/
预报中提到的地区具有产生甚高频、超高频或微波无线电波对流层弯曲的必要大气条件。对流层弯曲使电台和电视台的范围远远超出了正常范围,业余无线电爱好者可以在UV段进行超远距离通联。
电离D层预测
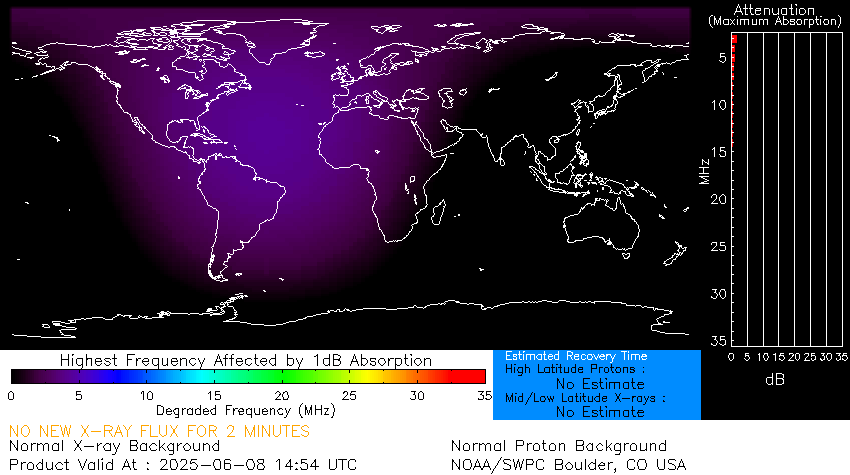
数据来源:美国国家海洋和大气管理局空间天气预测中心,https://www.swpc.noaa.gov
该模型用于分析太阳X射线通量和SEP事件对HF无线电通信的操作影响。使用高频(HF)无线电波(3-30 MHz)的远程通信取决于电离层中信号的反射。无线电波通常在F2层(海拔约300公里)的峰值附近反射,但沿着F2峰值和返回的路径,由于被中间的电离层吸收,无线电波信号会衰减。
太阳实时影像
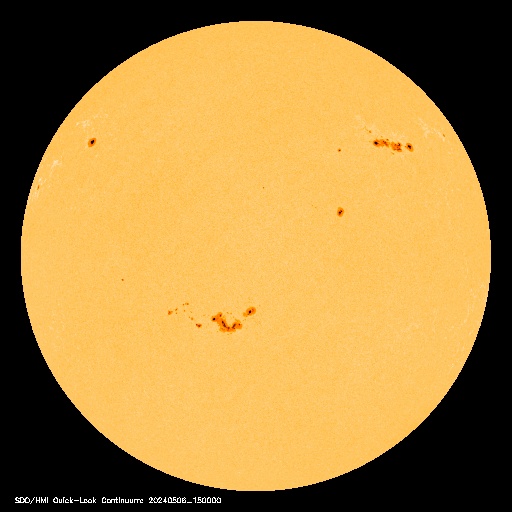
数据来源:SOHO(the Solar & Heliospheric Observatory),https://soho.nascom.nasa.gov